
Page 4 - Coffee Basics Brochure SCAE - English
P. 4
1.65 1.60 1.55 1.50 1.45 1.40 1.35 1.30 1.25 1.20 1.15 1.10 1.05 1.00
90g 85g
80g
75g
70g
65g
60g
55g
50g
45g
40g
THE TECHNIQUE OF BREWING CONTROL
COFFEE BREWING CONTROL CHART
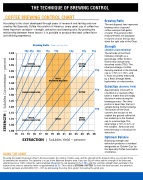
According to this chart developed through years of research and testing and now used by the Specialty Coffee Association of America, every great cup of coffee has three important variables—strength, extraction and brewing ratio. By plotting the relationship between these factors, it is possible to produce the ideal coffee flavor and drinking experience.
Brewing Ratio
The red diagonal lines represent brewing ratios of ground
coffee used per half-gallon
of water. The ground coffee measurements are displayed
in ounces across the top and down the right side of the Chart.
Strength
(Solubles Concentration)
The left side of the Chart indicates strength as a percentage. Other Control Charts may include total dissolved solids (TDS). The ideal percentage of coffee flavoring material in the finished cup is 1.15% to 1.35%, and
is most accurately measured by a Brew Strength Meter, hydrometer or refractometer.
Extraction (Solubles Yield)
Approximately one-fourth to one-third of a roasted coffee bean is matter that will readily dissolve in water during the brewing process. The other portion is bean fiber that isn’t soluble during normal brewing. The bottom of the Chart converts the fraction of the original dry ground coffee that has ended up in the finished cup to a percentage. The
ideal range is 18% to 22% of the solubles. Grind size and brew time play a critical part in extraction.
Optimum Balance
Balancing strength and extraction produces a standard designated as “Golden Cup” by the Specialty Coffee Association of America.
Brewing Ratio | Grams per One Litre
STRONG
STRONG
UNDER-DEVE
LOPED
BITTER
IDEAL
OPTIMUM BALANCE
UNDER-DEVE
LOPED
BITTER
WEAK
WEAK
WEAK
UNDER-DEVE
LOPED
BITTER
USING THE CHART
By using the weight of ground coffee in the brew basket, the volume of water used, and the strength of the brewed coffee, you can plot these to determine the extraction. The objective is to get to the Optimum Balance area. If you use 55g of coffee and the strength of the brew was determined to be 1.50%, follow the red line labeled 55g down the red diagonal to the 1.50% grid line, and then straight down vertically to the bottom of the chart to extraction which is approximately 23.5%. This coffee is STRONG / BITTER. To move the brew outcome, the extraction needs to decrease and fall within 18% - 22% by decreasing the brew time and/or increasing the grind size.
